Key Figures Sustainability
Climate and environment
|
|
|
2021
|
20202)
|
20192)
|
2018
|
2017
|
|---|---|---|---|---|---|---|
|
CO2 EMISSIONS |
CO2 EMISSIONS |
|
|
|
|
|
|
CO2 emissions (metric tonnes)3)
|
CO2 emissions (metric tonnes)3)
|
17 672
|
17 352
|
44 619
|
27 920
|
23 342
|
|
CO2 emissions from transport (metric tonnes) (first reported in 2015)4)
|
CO2 emissions from transport (metric tonnes) (first reported in 2 015)4)
|
17 270
|
21 931
|
24 409
|
7 546
|
9 175
|
|
Total CO2 emissions (metric tonnes)4)
|
Total CO2 emissions (metric tonnes)4)
|
34 942
|
39 283
|
69 028
|
35 466
|
32 517
|
|
CO2 emissions relative to sales (metric tonnes/MNOK)4)
|
CO2 emissions relative to sales (metric tonnes/MNOK)4)
|
1.3
|
1.5
|
3.1
|
2.5
|
2.2
|
|
CO2 emissions relative to man-years of labour (metric tonnes/
man-years of labour)4) |
CO2 emissions relative to man-years of labour (metric tonnes/
man-years of labour)4) |
3.2
|
3.7
|
6.9
|
5.2
|
4.7
|
|
ENERGY USE |
ENERGY USE |
|
|
|
|
|
|
Electricity (MWh)
|
Electricity (MWh)
|
131 205
|
122 510
|
133 686
|
102 071
|
92 795
|
|
Gas/oil (MWh)
|
Gas/oil (MWh)
|
10 371
|
6 195
|
6 277
|
4 095
|
5 397
|
|
Heat recovery (MWh)1) 4)
|
Heat recovery (MWh)1) 4)
|
41 187
|
32 865
|
38 060
|
25 004
|
26 208
|
|
Energy consumption (MWh) per employee
|
Energy consumption (MWh) per employee
|
16.4
|
15.1
|
15.3
|
19.2
|
18.2
|
|
Energy consumption (MWh/MNOK)4)
|
Energy consumption (MWh/MNOK)4)
|
6.7
|
6.3
|
7.4
|
9.1
|
8.6
|
|
WASTE (METRIC TONNES) |
WASTE (METRIC TONNES) |
|
|
|
|
|
|
Waste for recycling
|
Waste for recycling
|
6 408
|
5 422
|
5 712
|
937
|
866
|
|
Residual waste
|
Residual waste
|
789
|
1 029
|
1 080
|
549
|
665
|
|
Hazardous waste
|
Hazardous waste
|
882
|
969
|
1 038
|
402
|
353
|
- Energy recovery at Kongsberg Technology Park, as well as purchased district heating and remote cooling from external companies.
- The figures for 2019 include acquired companies. The figures for 2020 are exclusive the disposed subsidiary Hydroid.
- CO2 emissions (metric tonnes) for KONGSBERG. Emissions from the consumption of fossil fuels for the production of district heating supplied by Kongsberg Technology Park are included in direct emissions. Indirect emissions include the consumption of electricity, district heating and cooling from external suppliers within the business areas, as well as the consumption of electricity for the production of district heating and cooling in Kongsberg Technology Park.
- Figures for 2019 have been corrected.
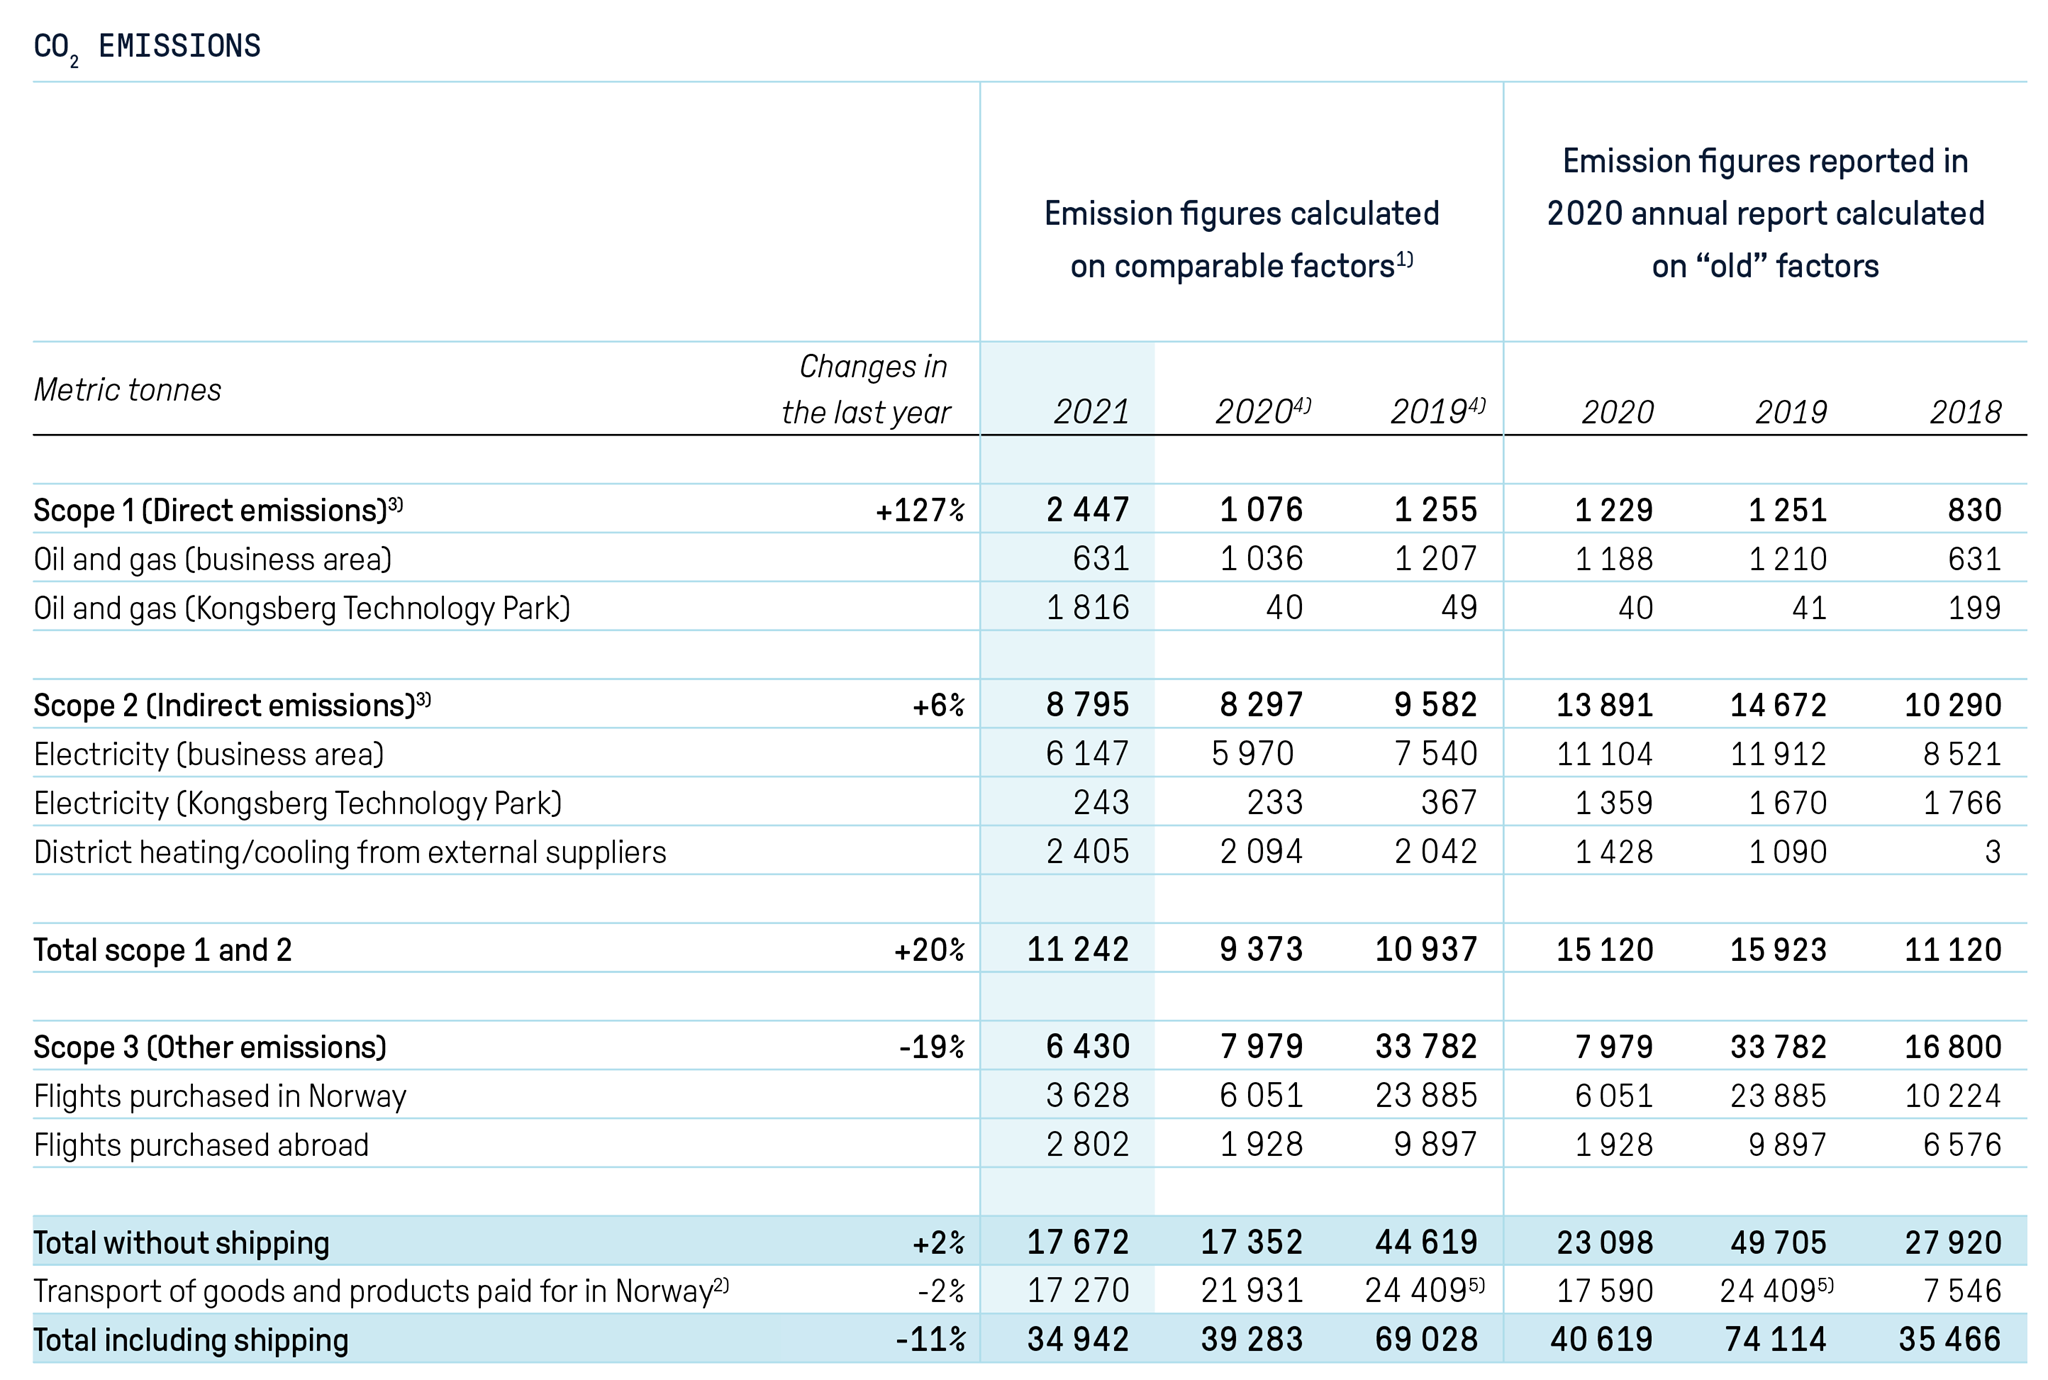
The environmental accounts includes the following sources of CO2 emissions
Direct emissions (Scope 1): Emissions from the use of fuel oil and gas for heating and processes, as well as from the production of district heating at Kongsberg Technology Park.
Indirect emissions from electricity (Scope 2): Emissions from electricity consumption and district heating or cooling from external suppliers. The CO2 emission factors used for electricity are location-based and in accordance with GHG Protocol Scope 2 Guidance 1).
Emissions from flights and the transport of goods and products (Scope 3): Emissions from flights and emissions associated with the transport of goods and merchandise 2).
1) Sources: Fossil fuel emission factors from the Department for Environment Food & Rural Affairs, UK 2021. For Norway, a location-based factor of 8 g per CO2 per kWh has been used, taken from the Association of issuing bodies (AIB) (this emission factor for Norway has not been used for previous reporting years).
2) CO2 emissions from transport of goods and products are data reported by the two main suppliers: DHL and DSV.
3) CO2 emissions (metric tonnes) for KONGSBERG. Emissions from the consumption of fossil fuels for the production of district heating supplied by Kongsberg Technology Park are included in direct emissions. Indirect emissions include the consumption of electricity, district heating and cooling from external suppliers within the business areas, as well as the consumption of electricity for the production of district heating and cooling in Kongsberg Technology Park.
4) The figures for 2019 include acquired companies. The figures for 2020 are exclusive the disposed subsidiary Hydroid.
5) The figures for 2019 are corrected for changes in reporting format for freight.
Financial value creation
|
MNOK
|
MNOK
|
2021
|
2020
|
2019
|
2018
|
2017
|
|---|---|---|---|---|---|---|
|
ADDED VALUE |
ADDED VALUE |
|
|
|
|
|
|
Salaries
|
Salaries
|
7 760
|
7 472
|
6 908
|
4 638
|
4 417
|
|
Dividends
|
Dividends
|
2 736
|
1 440
|
2 250
|
450
|
450
|
|
Dividends – % of earnings
|
Dividends – % of earnings
|
119.5%
|
49.1%
|
313.8%
|
64.0%
|
80.5%
|
|
Interest to lenders
|
Interest to lenders
|
72
|
99
|
122
|
103
|
110
|
|
Retained earnings
|
Retained earnings
|
(446)
|
1 492
|
267
|
254
|
109
|
|
OTHER FINANCIAL KEY FIGURES |
OTHER FINANCIAL KEY FIGURES |
|
|
|
|
|
|
Costs related to the purchase of goods and services
|
Costs related to the purchase of goods and services
|
13 387
|
12 851
|
13 059
|
7 239
|
7 610
|
|
Financial support received from authorities
|
Financial support received from authorities
|
120
|
121
|
103
|
53
|
59
|
|
INCOME TAX EXPENSE1) |
INCOME TAX EXPENSE1) |
|
|
|
|
|
|
Norway
|
Norway
|
332
|
152
|
92
|
61
|
(15)
|
|
Rest of Europe
|
Rest of Europe
|
178
|
136
|
71
|
14
|
13
|
|
North and South America
|
North and South America
|
62
|
47
|
47
|
38
|
33
|
|
Asia, Africa and Australia
|
Asia, Africa and Australia
|
60
|
40
|
40
|
27
|
64
|
|
Total
|
Total
|
632
|
374
|
250
|
140
|
95
|
- Tax expences for 2019 includes tax expences for disposed of activities.
Social investments
|
MNOK
|
MNOK
|
2021
|
2020
|
2019
|
2018
|
2017
|
|---|---|---|---|---|---|---|
|
|
|
|
|
|
|
|
|
Financial support to organisations, etc. 1)
|
Financial support to organisations, etc. 1)
|
14.5
|
7.6
|
6.8
|
6.9
|
9.1
|
- In addition, there is funding for professorships and direct costs such as wages etc. for our own employees contributing in part-time positions at various colleges and educational institutions. See focus area "Corporate social responsibility" for further information.
Employees
|
|
|
2021
|
2020
|
2019
|
2018
|
2017
|
|---|---|---|---|---|---|---|
|
LEVEL OF EDUCATION |
LEVEL OF EDUCATION |
|
|
|
|
|
|
Master's degree (%)
|
Master's degree (%)
|
26
|
24
|
23
|
29
|
29
|
|
– of which doctorates (PhD)
|
– of which doctorates (PhD)
|
1
|
1
|
1
|
2
|
2
|
|
Bachelor’s degree (%)
|
Bachelor’s degree (%)
|
36
|
31
|
30
|
36
|
35
|
|
Technicians (%)
|
Technicians (%)
|
10
|
9
|
7
|
12
|
12
|
|
Production workers (%)
|
Production workers (%)
|
15
|
14
|
16
|
11
|
11
|
|
Other (%)
|
Other (%)
|
12
|
21
|
21
|
11
|
13
|
|
NUMBER OF EMPLOYEES |
NUMBER OF EMPLOYEES |
|
|
|
|
|
|
Number of employees, total
|
Number of employees, total
|
11 122
|
10 689
|
10 793
|
6 842
|
6 830
|
|
Number of full-time equivalents (FTEs)
|
Number of full-time equivalents (FTEs)
|
10 940
|
10 565
|
10 704
|
6 771
|
6 728
|
|
Number of full-time employees
|
Number of full-time employees
|
10 810
|
10 252
|
10 488
|
6 674
|
6 636
|
|
Number of part-time employees
|
Number of part-time employees
|
312
|
437
|
305
|
168
|
194
|
|
AGE |
AGE |
|
|
|
|
|
|
Average age
|
Average age
|
44
|
43
|
44
|
43
|
43
|
|
Employees under age 30 (%)
|
Employees under age 30 (%)
|
12
|
12
|
12
|
13
|
14
|
|
Employees between ages 30 and 50 (%)
|
Employees between ages 30 and 50 (%)
|
56
|
59
|
58
|
59
|
57
|
|
Employees over age 50 (%)
|
Employees over age 50 (%)
|
32
|
29
|
30
|
28
|
29
|
|
Members of the BoD (KONGSBERG ASA) between 30-50 years old as a %
|
Members of the BoD (KONGSBERG ASA) between 30-50 years old as a %
|
37.5
|
|
|
|
|
|
Members of the BoD over 50 years old as a %
|
Members of the BoD over 50 years old as a %
|
62.5
|
|
|
|
|
|
PERCENTAGE OF WOMEN |
PERCENTAGE OF WOMEN |
|
|
|
|
|
|
Women as a % of the number of employees
|
Women as a % of the number of employees
|
20.4
|
20.1
|
19.5
|
21.8
|
21.5
|
|
Women in managerial positions as a % of total managerial positions
|
Women in managerial positions as a % of total managerial positions
|
18.7
|
19
|
21
|
20
|
20
|
|
Kvinner i ledende stillinger nivå 1-3 i % av totale lederstillinger
|
Kvinner i ledende stillinger nivå 1-3 i % av totale lederstillinger
|
25
|
23
|
23
|
26
|
22
|
|
Shareholder-elected women on the Board (%)
|
Shareholder-elected women on the Board (%)
|
40
|
40
|
40
|
60
|
60
|
|
TURNOVER |
TURNOVER |
|
|
|
|
|
|
Turnover (employees who have resigned)
|
Turnover (employees who have resigned)
|
686
|
388
|
809
|
465
|
357
|
|
Turnover (%)
|
Turnover (%)
|
6.2
|
3.6
|
7.5
|
6.8
|
5.2
|
|
– Men
|
– Men
|
4.9
|
2.8
|
5.1
|
5.6
|
4.2
|
|
– Turnover men, of total men
|
– Turnover men, of total men
|
6.1
|
3.5
|
6.6
|
7.1
|
5.4
|
|
– Women
|
– Women
|
1.3
|
0.9
|
2.4
|
1.2
|
1
|
|
– Turnover women, of total women
|
– Turnover women, of total women
|
6.3
|
4.2
|
13.1
|
5.6
|
4.7
|
Health and safety
|
|
|
2021
|
2020
|
2019
|
2018
|
2017
|
|---|---|---|---|---|---|---|
|
|
|
|
|
|
|
|
|
Sick leave as a % of hours worked
|
Sick leave as a % of hours worked
|
3
|
2.9
|
2.6
|
2.6
|
2.3
|
|
Sick leave for the Norwegian companies
|
Sick leave for the Norwegian companies
|
3.2
|
3.2
|
3.1
|
3.0
|
2.8
|
|
Number of reported injuries per million hours worked (TRI)1)
|
Number of reported injuries per million hours worked (TRI)1)
|
2.2
|
1.7
|
2.3
|
1.6
|
3.2
|
|
Number of lost time days per million hours worked (ISR)
|
Number of lost time days per million hours worked (ISR)
|
30
|
21.2
|
31.4
|
17.6
|
16.2
|
|
Number of reported injuries leading to absence among employees
|
Number of reported injuries leading to absence among employees
|
37
|
26
|
30
|
13
|
31
|
|
Total number of injuries among employees2)
|
Total number of injuries among employees2)
|
79
|
103
|
111
|
71
|
129
|
|
Total number of near-accidents among employees
|
Total number of near-accidents among employees
|
908
|
684
|
387
|
379
|
232
|
|
Registered work-related fatalities
|
Registered work-related fatalities
|
0
|
0
|
0
|
0
|
0
|
- Includes lost time injuries and injuries involving medical treatment.
- Includes lost time injuries, injuries involving medical treatment and injuries treated with first-aid.
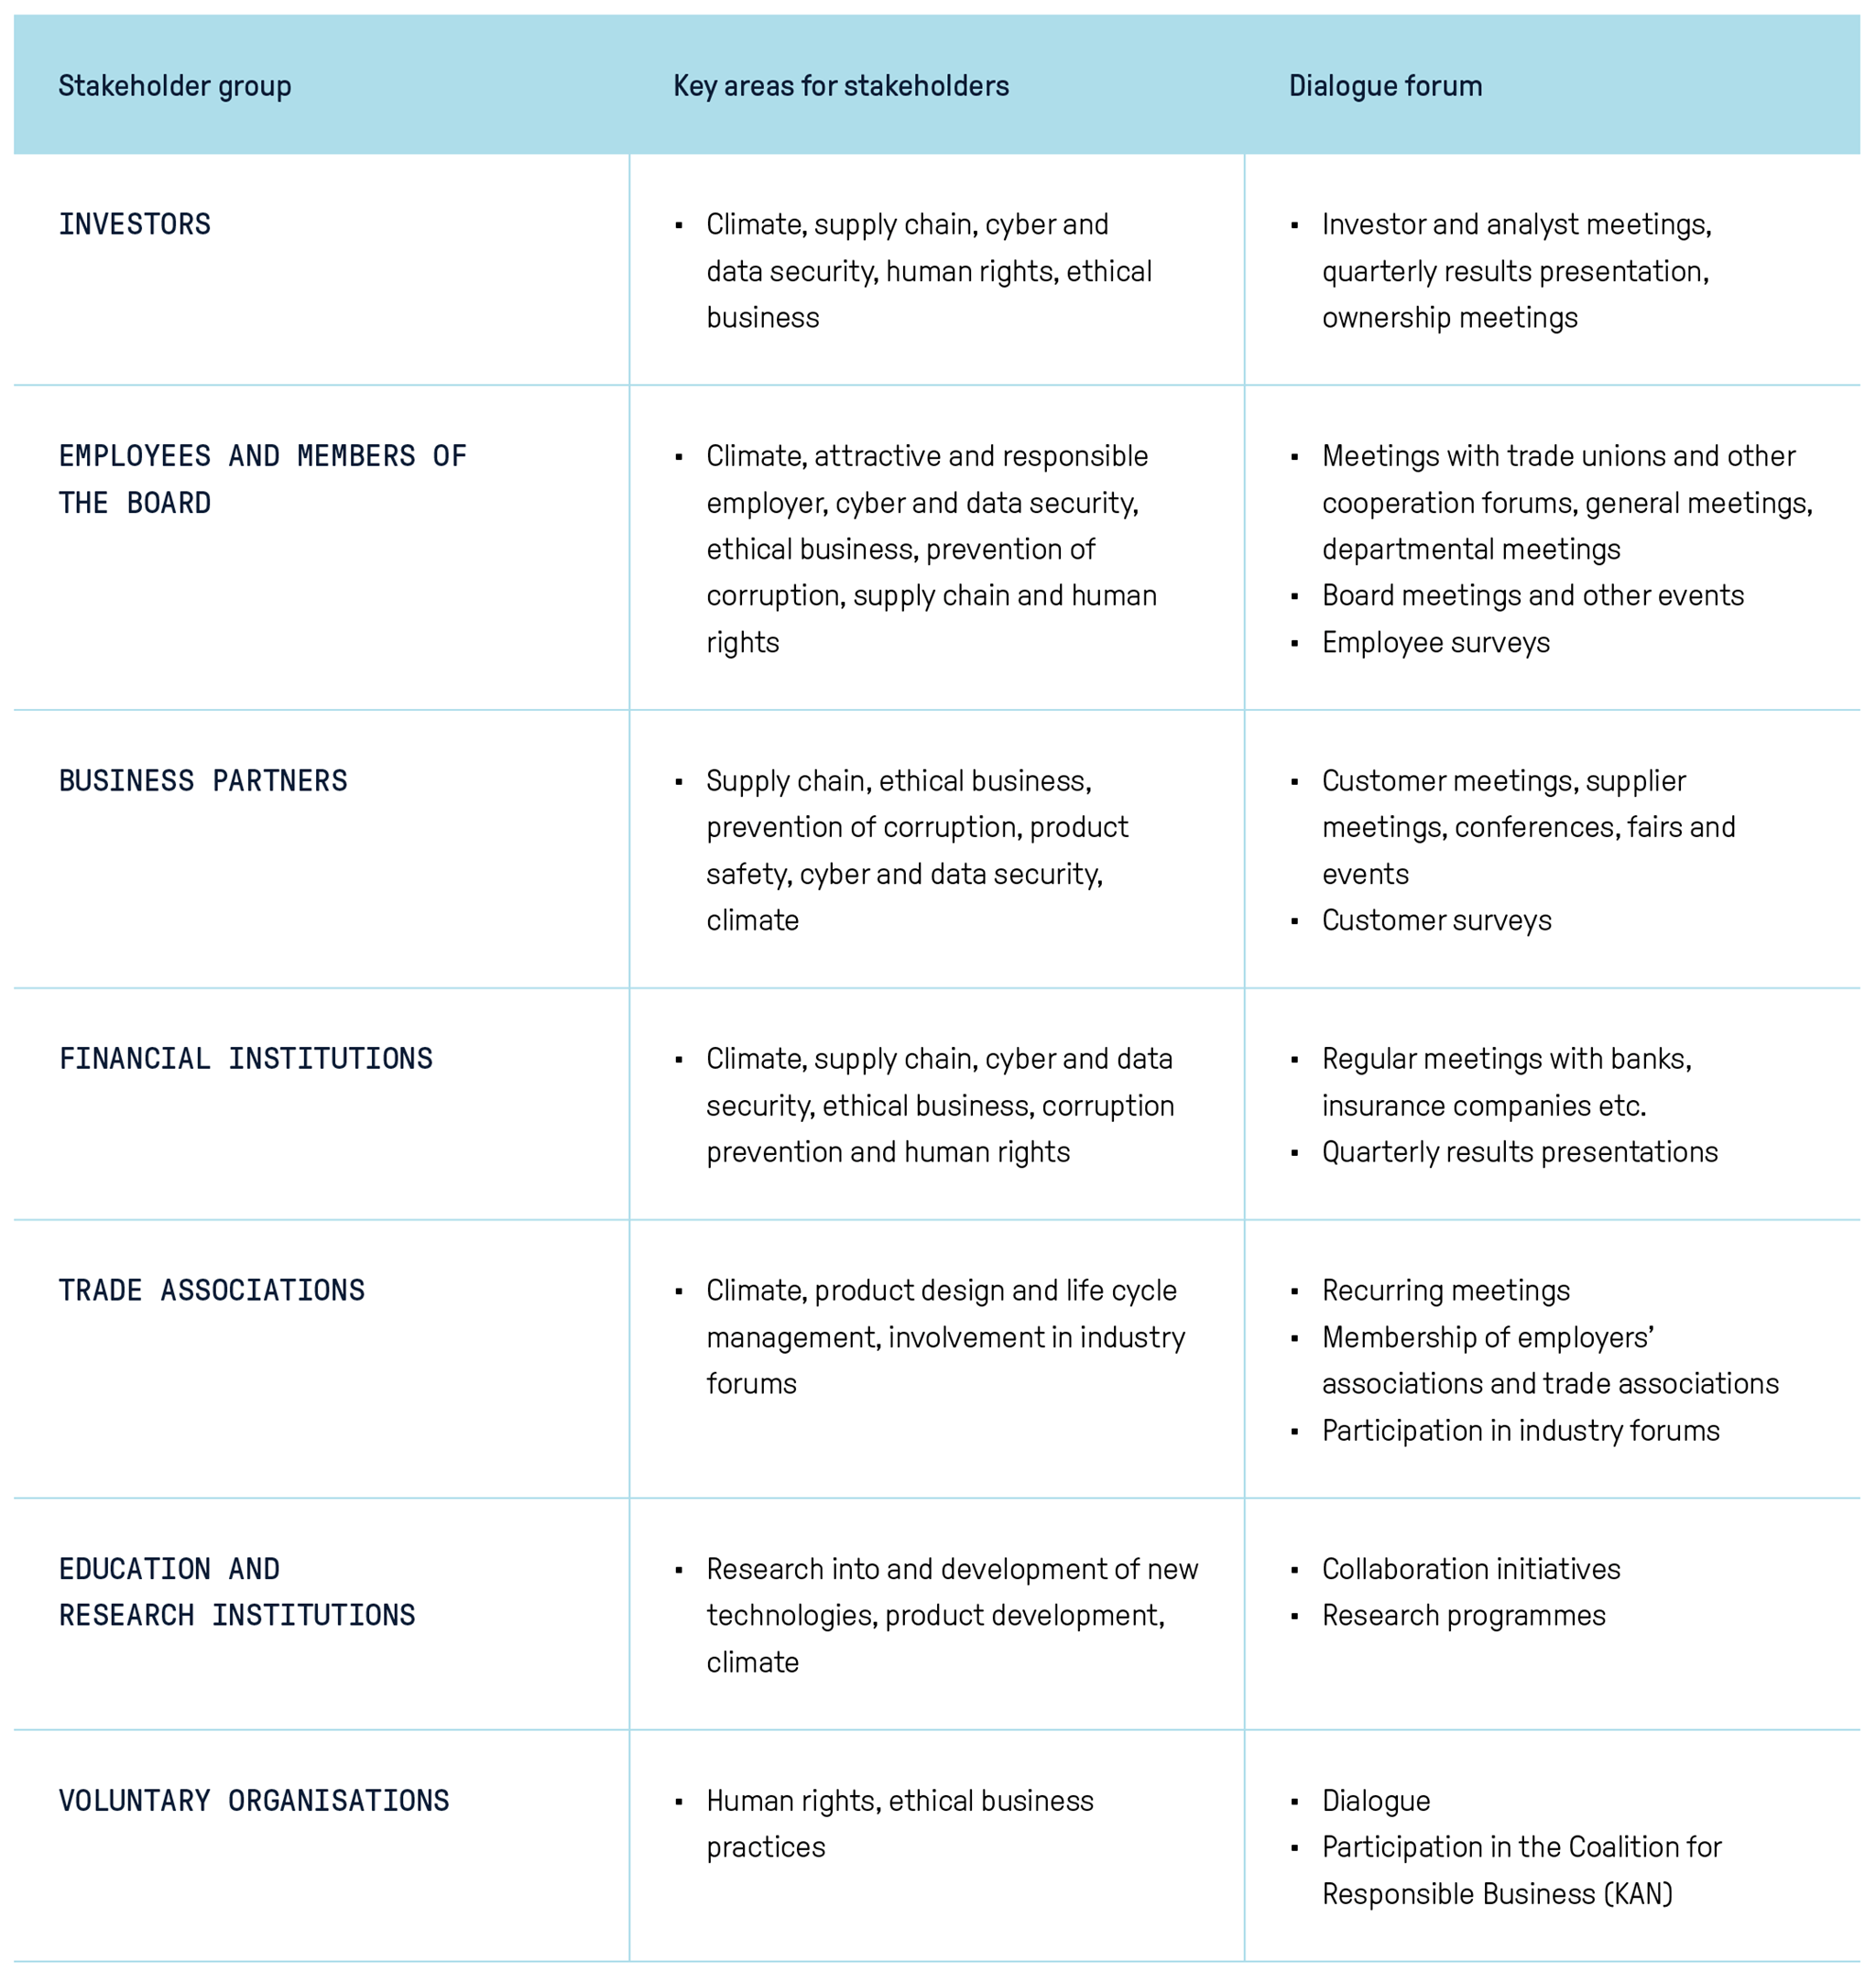
Stakeholder dialogue
Below there is an overview of the most important themes and arenas where we have dialogue with our stakeholders.