Key Figures 2021
KONGSBERG
- EBITDA */**MNOK 4 086
- EBIT */**MNOK 2 863
- Profit for the year *MNOK 2 290
- Dividend per share ***NOK 15.30
- Earnings per share after taxNOK 12.06
- Market capitalisationMNOK 51 146
Notes to the charts
*) Figures in the income statement, orderintake and order backlog for 2019 and 2018 are adjusted for discontinued operations. Comparable figures earlier years are not adjusted.
**) From 2020 onwards profit shares are not longer included in EBITDA and EBIT. Compareable figures are adjusted.
***) Proposed dividend per share for 2021 is NOK 15.30 whereof NOK 3.30 is according to the ordinary dividend policy.
Key figures 2021
|
MNOK
|
MNOK
|
2021
|
2020
|
20193)
|
20183)
|
2017
|
2016
|
2015
|
2014
|
2013
|
2012
|
|---|---|---|---|---|---|---|---|---|---|---|---|
|
SALES |
SALES |
|
|
|
|
|
|
|
|
|
|
|
Revenues
|
Revenues
|
27 449
|
25 612
|
23 245
|
13 807
|
14 490
|
15 845
|
17 032
|
16 613
|
16 323
|
15 652
|
|
New orders
|
New orders
|
40 979
|
28 818
|
31 413
|
15 879
|
13 430
|
14 319
|
15 238
|
22 097
|
15 043
|
14 605
|
|
Order backlog
|
Order backlog
|
49 535
|
35 947
|
32 347
|
16 707
|
15 629
|
16 914
|
19 597
|
21 020
|
15 687
|
16 523
|
|
Book-to-bill ratio
|
Book-to-bill ratio
|
1.49
|
1.12
|
1.35
|
1.15
|
0.9
|
0.9
|
0.9
|
1.3
|
0.9
|
0.9
|
|
PERFORMANCE |
PERFORMANCE |
|
|
|
|
|
|
|
|
|
|
|
Earnings before interest, taxes, depreciation and amortisation (EBITDA)1)4)
|
Earnings before interest, taxes, depreciation and amortisation (EBITDA)1)4)
|
4 086
|
3 250
|
2 113
|
1 126
|
1 092
|
988
|
1 697
|
1 998
|
2 142
|
2 294
|
|
Earnings before interest and taxes (EBIT)1)4)
|
Earnings before interest and taxes (EBIT)1)4)
|
2 863
|
1 905
|
1 029
|
701
|
585
|
462
|
857
|
1 196
|
1 659
|
1 840
|
|
Earnings before taxes (EBT)
|
Earnings before taxes (EBT)
|
1 855
|
1 855
|
833
|
780
|
654
|
729
|
944
|
1 285
|
1 644
|
1 809
|
|
Earnings after tax
|
Earnings after tax
|
2 290
|
2 932
|
717
|
704
|
559
|
651
|
755
|
880
|
1 225
|
1 304
|
|
PROFITABILITY |
PROFITABILITY |
|
|
|
|
|
|
|
|
|
|
|
EBITDA % 4)
|
EBITDA % 4)
|
14.9%
|
12.7%
|
9.1%
|
8.2%
|
7.5%
|
6.2%
|
10.0%
|
12.0%
|
13.1%
|
14.7%
|
|
EBIT % 4)
|
EBIT % 4)
|
10.4%
|
7.4%
|
4.4%
|
5.1%
|
4.0%
|
2.9%
|
5.0%
|
7.2%
|
10.2%
|
11.8%
|
|
BALANCE SHEET |
BALANCE SHEET |
|
|
|
|
|
|
|
|
|
|
|
Equity
|
Equity
|
13 618
|
13 301
|
12 810
|
12 626
|
7 365
|
6 725
|
6 127
|
6 282
|
6 657
|
6 274
|
|
Equity ratio % 5)
|
Equity ratio % 5)
|
34.6%
|
33.9%
|
32.8%
|
45.7%
|
35.6%
|
31.7%
|
32.0%
|
31.0%
|
38.2%
|
38.6%
|
|
Net interest-bearing debt
|
Net interest-bearing debt
|
(5 668)
|
(3 949)
|
(1 565)
|
(5 706)
|
384
|
2 195
|
(941)
|
(3 551)
|
(1 935)
|
(1 198)
|
|
Working capital1)
|
Working capital1)
|
(2 003)
|
(458)
|
17
|
(14)
|
955
|
2 533
|
2 698
|
155
|
775
|
1 000
|
|
Roace1)
|
Roace1)
|
32.7%
|
20.8%
|
10.0%
|
12.5%
|
9.1%
|
8.2%
|
21.8%
|
35.9%
|
32.5%
|
36.3%
|
|
EMPLOYEES |
EMPLOYEES |
|
|
|
|
|
|
|
|
|
|
|
Number of employees, total
|
Number of employees, total
|
11 122
|
10 689
|
10 793
|
6 842
|
6 830
|
7 159
|
7 688
|
7 664
|
7 493
|
7 259
|
|
Number of reported injuries per million hours worked (TRI)
|
Number of reported injuries per million hours worked (TRI)
|
2.2
|
1.7
|
2.3
|
1.6
|
3.2
|
3.5
|
4.1
|
4.7
|
3.7
|
1.5
|
|
Number of lost time days per million hours worked (ISR)
|
Number of lost time days per million hours worked (ISR)
|
30.0
|
21.2
|
31.4
|
17.6
|
16.2
|
32
|
14.2
|
45.3
|
15.6
|
13.6
|
|
THE ENVIRONMENT2) 5) |
THE ENVIRONMENT2) 5) |
|
|
|
|
|
|
|
|
|
|
|
Energy consumption (GWh)
|
Energy consumption (GWh)
|
182.8
|
161.6
|
178.4
|
131.2
|
124.4
|
122.8
|
119.35
|
123.7
|
127
|
114.7
|
|
CO2 emissions (metric tonnes)
|
CO2 emissions (metric tonnes)
|
34 942
|
39 283
|
69 028
|
35 466
|
32 517
|
33 464
|
39 268
|
26 006
|
25 294
|
19 579
|
|
Waste (metric tonnes)
|
Waste (metric tonnes)
|
8 079
|
7 420
|
7 830
|
1 888
|
1 884
|
1 986
|
2 368
|
1 788
|
1 935
|
1 784
|
|
OWNER'S VALUE |
OWNER'S VALUE |
|
|
|
|
|
|
|
|
|
|
|
Market capitalisation
|
Market capitalisation
|
51 146
|
31 714
|
24 839
|
21 167
|
18 120
|
14 940
|
17 400
|
14 760
|
15 300
|
14 940
|
|
Earnings per share after tax (EPS) in NOK
|
Earnings per share after tax (EPS) in NOK
|
12.06
|
16.08
|
3.89
|
5.58
|
4.62
|
5.44
|
6.23
|
7.28
|
10.24
|
10.91
|
|
P/E in NOK
|
P/E in NOK
|
23.71
|
10.82
|
34.64
|
30.2
|
32.70
|
22.95
|
23.05
|
16.77
|
12.49
|
11.46
|
|
Dividend per share in NOK6)
|
Dividend per share in NOK6)
|
15.30
|
8.0
|
12.5
|
2.5
|
3.75
|
3.75
|
4.25
|
9.25
|
5.25
|
3.75
|
- See Note 31 for definitions.
- See Climate and Environmental Accounts for comparable figures.
- Figures in the income statement, orderintake and order backlog for 2019 and 2018 are adjusted for discontinued operations. Comparable figures earlier years are not adjusted.
- From 2020 onwards profit shares are not longer included in EBITDA and EBIT. Compareable figures are adjusted.
- Figures for 2019 have been corrected.
- Proposed dividend per share for 2021 is NOK 15.30 whereof NOK 3.30 is according to the ordinary dividend policy.
Historical development1)2)
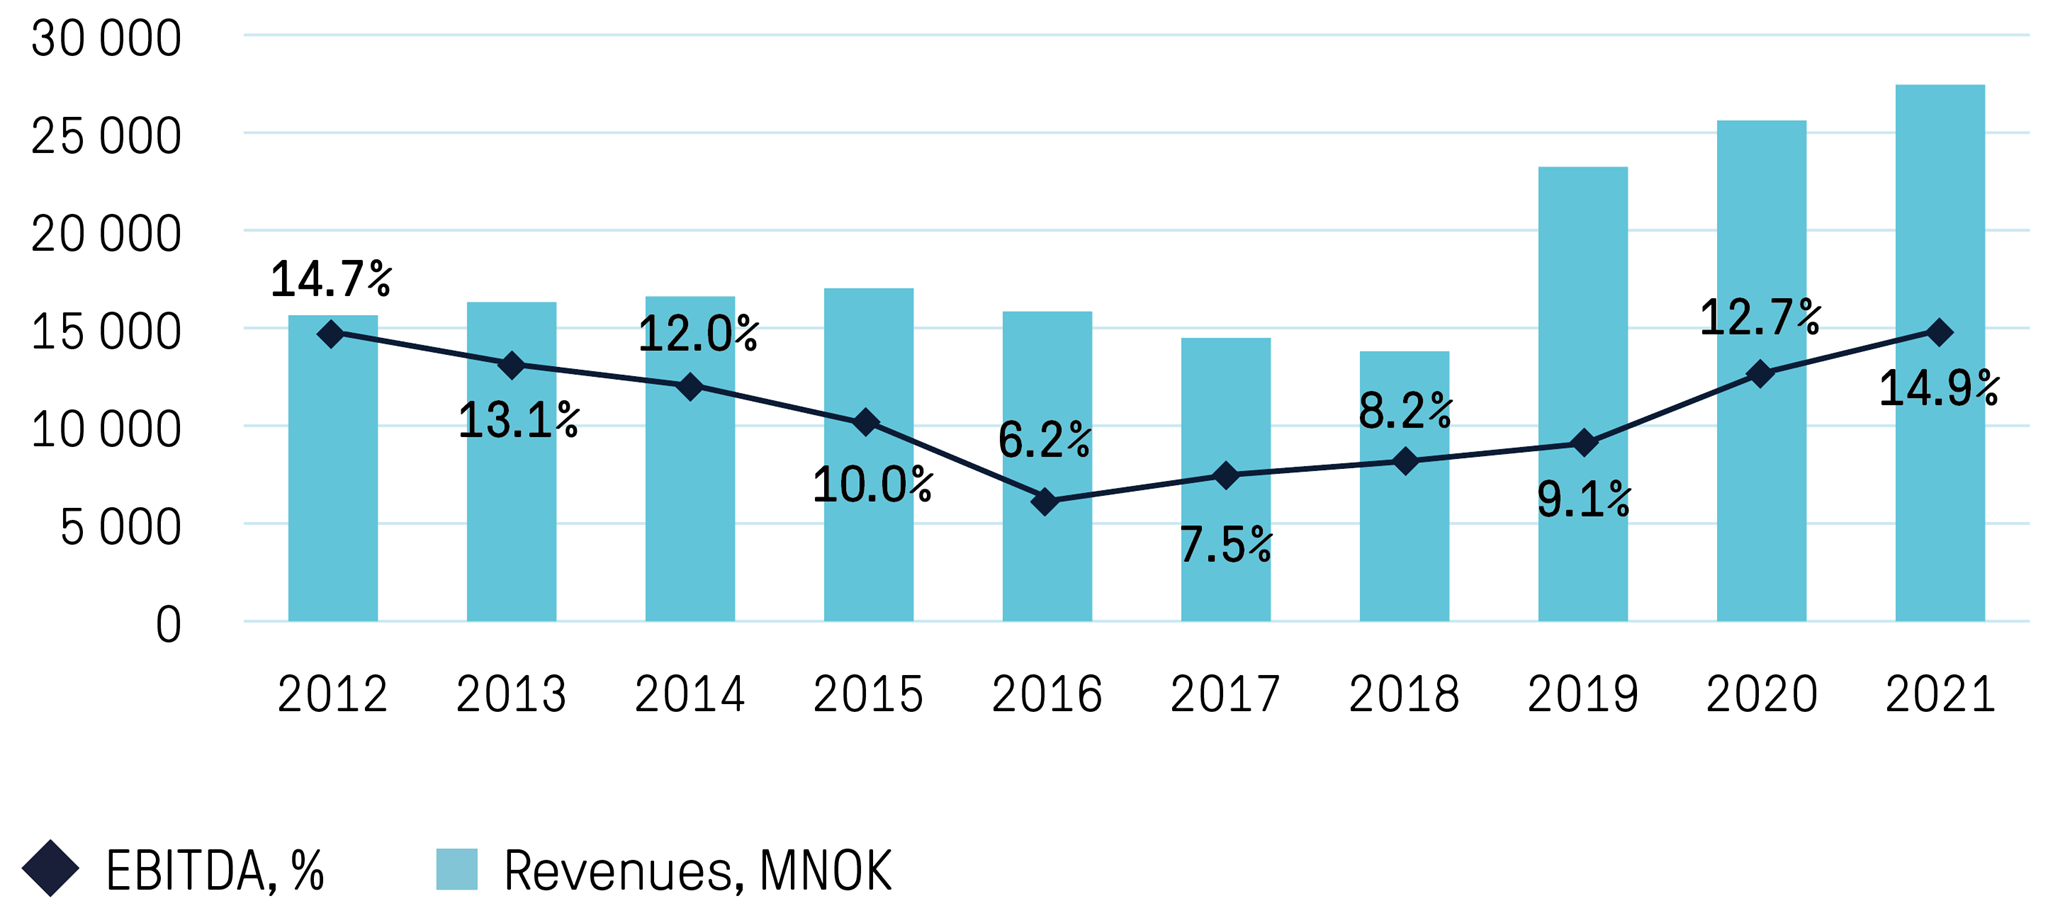
Note to the chart 'Historical Development'
1) Figures for income statement for 2019 and 2018 are adjusted for disposed companies. Other figures are not adjusted.
2) From 2020 onwards profit shares are not longer included in EBITDA and EBIT. Compareable figures are adjusted.
*) From 2020 onwards profit shares are not longer included in EBITDA. Compareable figures are adjusted.
*) Figures in the income statement, orderintake and order backlog for 2019 and 2018 are adjusted for discontinued operations. Comparable figures earlier years are not adjusted.
*) From 2020 onwards profit shares are not longer included in EBITDA. Compareable figures are adjusted.